Impact of Scanners and Staining of WSIs on CNNs
Convolutional Neural Networks (CNNs) and deep learning are increasingly being used to evaluate prostate cancer in whole-slide images (WSIs) in Pathology. With an aging population, pathologists are expected to evaluate 15 million prostate biopsy speciments anually. Automating a part of the evaluation of prostate biopsies through CNNs might help mitigate the lack of well-trained pathologists. However, different preparation and staining procedures of histological slides can result in a CNN trained on data from one center failing to perform well on data from another center. Zaneta Swiderska-Chadaj et al. from the Diagnostic Image Analysis Group investigated the robustness of CNNs on multi-center WSIs of prostate cancer. Their work appeared online in Nature Scientific Reports and can be accessed here.
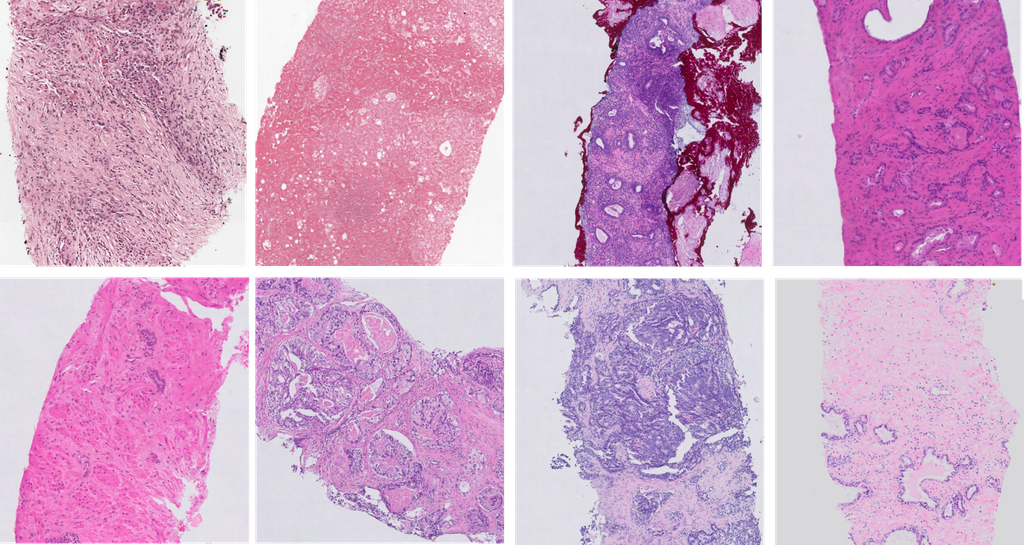
The figure above shows an example of the heterogeneity in appearance in prostate biopsy specimens. They performed 4 sets of experiments to investigate the robustness of CNNs in evaluating WSIs of prostate cancer.
1. Compare different deep learning approaches
To study the robustness of CNNs, the best deep learning approach needs to be identified. For this task, they evaluated the performance of U-Net, DenseNetFCN and EfficientNet for prostate cancer classification on a development dataset of 582 WSIs using 3-fold cross validation. For whole-slide level classification, where each slide is labeled as either cancer or normal, the U-Net performed the best with an AUC of 0.98.
2. Evaluation on independent test sets
In this experiment, the U-Net was trained on the development set of 582 WSIs and validated on two independent datasets of 85 and 50 WSIs. The U-Net achieved AUCs of 0.92 and 0.83 respectively. The drop in performance on the first independent set (IT1) was observed to be within acceptable limits but the drop in the second independent set (IT2) was considered unacceptable for adoption in clinical practice. They note that scanner variation, tissue preparation and staining procedures at different centers could have contributed to the performance drop. This is analogous to the results from Campanella et al. (2019), which show that even with extensive data augmentation, performance of deep learning algorithms deteriorate on data from different institutions and scanning systems.
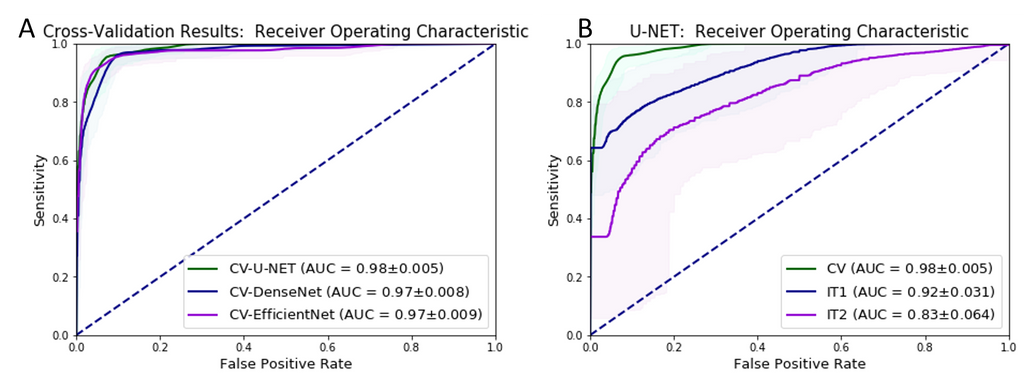
The figure above shows the ROC curves for whole-slide prostate cancer classification of (A) the different deep learning approaches on the development set, and (B) the performance of the best deep learning approach (U-Net) on independent datasets of WSIs (independent test set I (IT1) and independent test set II (IT2)).
3. Influence of scanner variability
In this experiment, the independent test sets were re-scanned on the Philips Ultrafast scanner. The U-Net was evaluated on the rescanned images, and achieved AUCs of 0.91 and 0.88 respectively, showcasing that the performance drop can be partly attributed to scanner variations.
4. Influence of color and style normalization
When the WSIs from the independent test sets were color normalized using the whole-slide image color standardizer (WSICS) algorithm, the U-Net achieved AUCs of 0.96 and 0.81. However, when the WSIs were style-normalized using a cycle-GAN, the performance of the U-Net improved drastically with AUCs of 0.98 and 0.97, matching the performance seen during 3-fold cross validation in the development set. This shows that the generalization gap that was seen earlier can be closed using appropriate pre-processing.
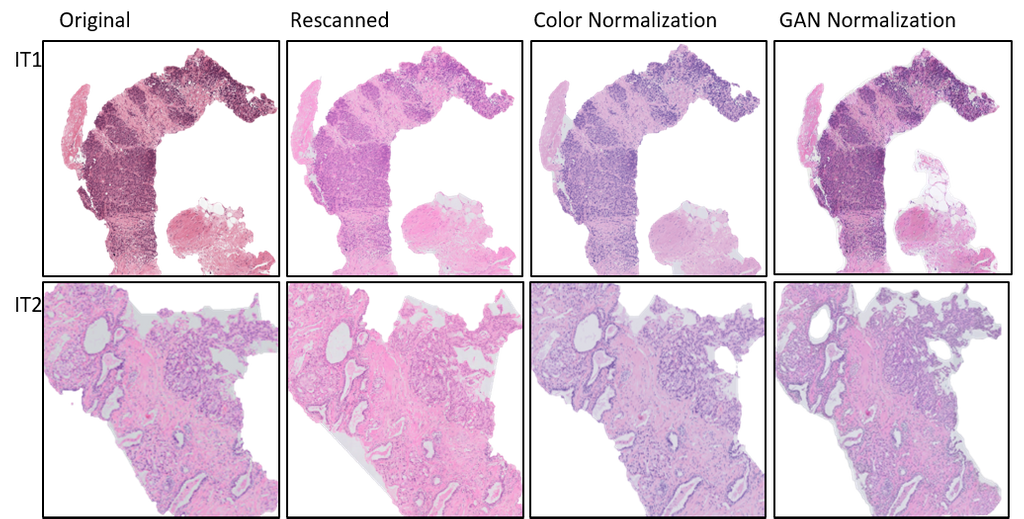
The figure above shows an example of re-scanned specimens and color normalized slides for (A) independent test set I (IT1) and (B) independent test set II (IT2).
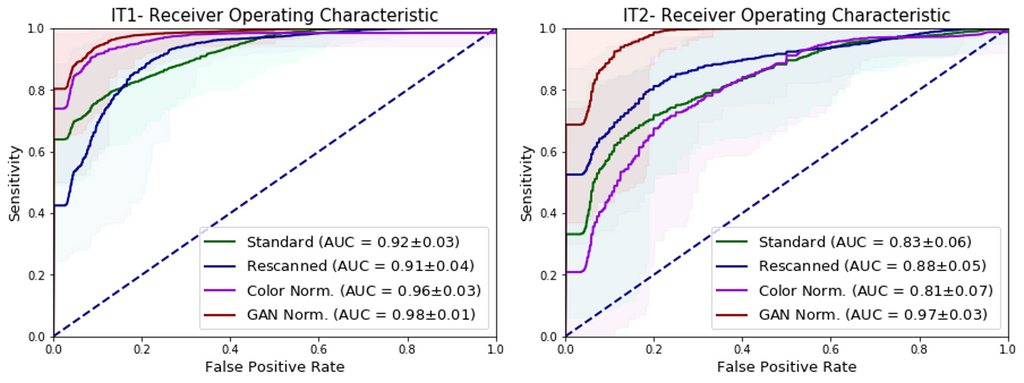
The figure above shows the ROC curves of the U-Net for whole-slide prostate cancer classification when presented with re-scanned, color normalized and cycle-GAN normalized WSIs on (A) independent test set I (IT1) and (B) independent test set II (IT2).
Conclusions
They conclude by saying that (a) data augmentation and multi-center training data alone do not address all sources of bias in a trained model, (b) normalization as a pre-processing step can significantly improve algorithm output, and (c) full style normalization allows for a more accurate slide normalization compared to only using color normalization.
More details about their work can be accessed online here.
← Back to overview