Kiran Vaidhya Venkadesh, Jasper Linmans, Bram van Ginneken, Mathias Prokop, Colin Jacobs
Introduction
Accurately estimating the malignancy risk of pulmonary nodules is crucial for optimizing nodule management in lung cancer screening. We recently published a study in Radiology describing a deep learning (DL) algorithm that estimates the malignancy risk of pulmonary nodules at a level comparable to that of thoracic radiologists. In addition, the algorithm outperformed the clinically established PanCan model.
Despite its excellent performance, the algorithm’s malignancy risk estimates were poorly calibrated, noted in Tammemägi’s editorial that accompanied our publication. In this blog, we describe how we used Platt’s scaling to calibrate the outputs of our algorithm.
Platt’s Scaling
Modern neural networks tend to have poor calibration due to increased network capacity and less regularization, to name a few reasons. The resulting predictions from a poorly calibrated model may not represent the real estimates of the probabilities. In our DL algorithm, we averaged the raw logits of ten 3D CNNs and ten 2D CNNs as part of an ensemble to estimate the malignancy risk of a new nodule. After averaging the raw logits from the 20 CNNs, we applied the sigmoid filter to squash the outputs between 0 and 1. However, the raw logits had a wide range, which resulted in poorly calibrated outputs after filtering them with the sigmoid layer. The resulting polarization can be seen in the histogram plots of outputs in the development cohort from the NLST and the full external validation cohort from the DLCST (Fig 1).
Platt’s scaling is a method that transforms the outputs of a classification model into a probability distribution over the classes. In this method, a two-parameter logistic regression model is used as the calibrator whose weights are derived from the development data to calibrate the outputs of another model like a neural network. The probability estimates (P) for a vector of uncalibrated outputs (X) is given by the following equation:
P(X) = 1 / (1 + e- (A * logit(X) + B))
The logit function performs the inverse transformation to the sigmoid function and is defined by logit(p) = log(p/(1-p)); this was done to transform the probabilities back into the logits before applying calibration. The scalars A and B were derived from the development data as stated previously. Cross-validation is often used to prevent the calibrator from over-fitting during the calibration process. In this work, we derived the weights of the calibrator using 10-fold cross-validation.
We derived the weights of the calibrator using our NLST cohort comprising 1,249 malignant nodules and 14,828 benign nodules. This cohort was also used for the development of the DL algorithm as described in our manuscript. Figures 1 and 2 show the visual assessment of the calibration of the DL algorithm before and after Platt’s scaling through histogram density plots and reliability curves for the NLST and the DLCST cohorts. Table 1 shows the binary cross-entropy loss and the Brier score loss of the algorithm’s outputs on the NLST and DLCST cohorts. Figure 3 shows the calibrated risk scores for the same nodules that were shown in Figure 5 of our manuscript.
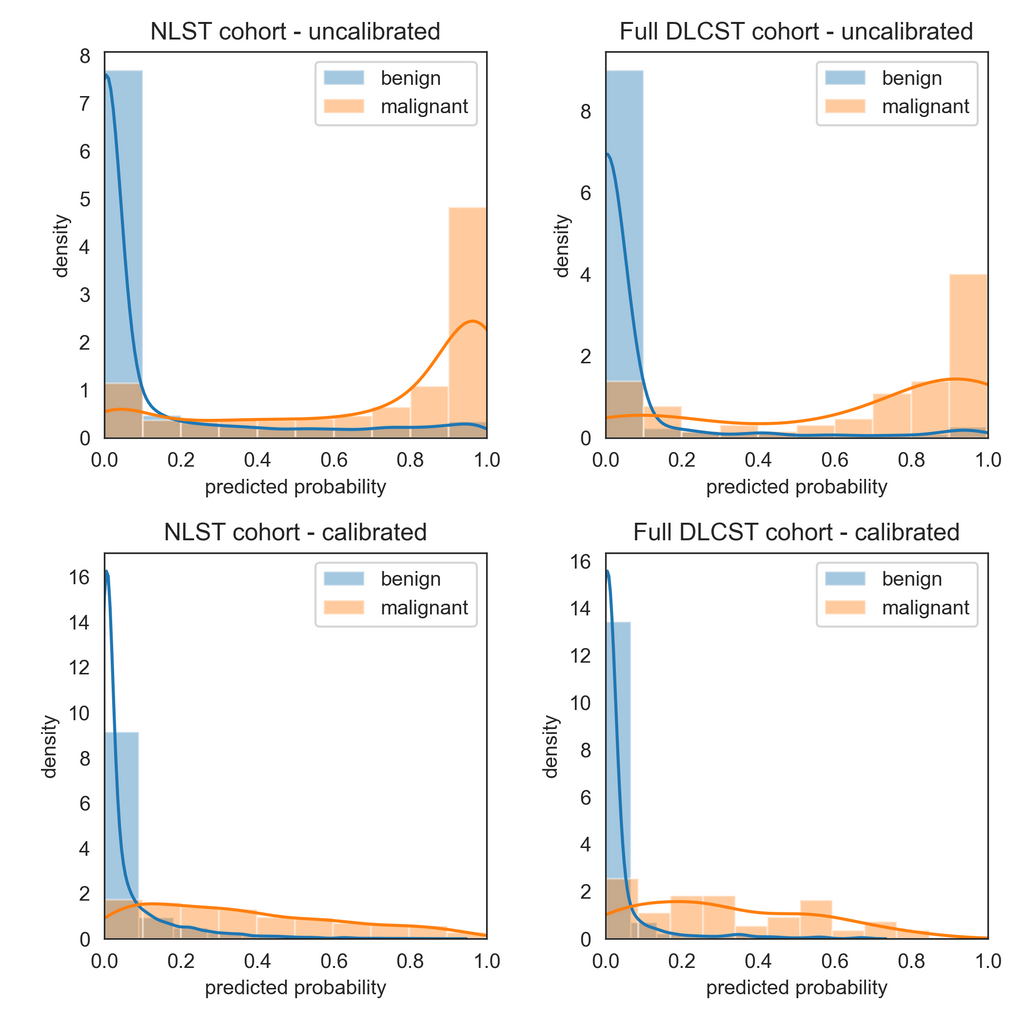
Figure 1. Visual assessment of the calibration of the deep learning (DL) algorithm for malignancy risk estimation of pulmonary nodules detected at screening CT through histogram density plots of outputs in the development cohort from the National Lung Screening Trial (NLST), left, and the full external validation cohort (DLCST), right, before (top) and after (bottom) calibration with Platt’s scaling.
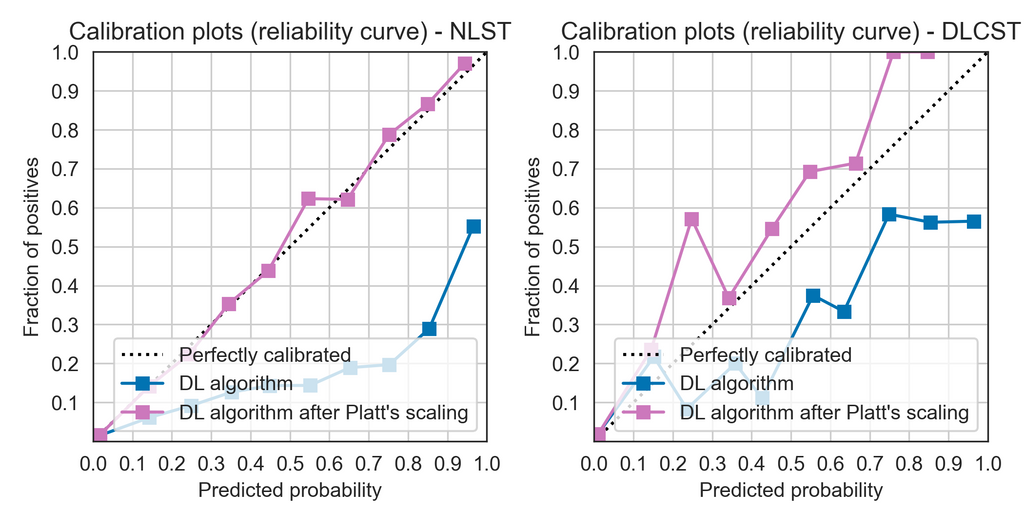
Figure 2. Visual assessment of the calibration of the deep learning (DL) algorithm for malignancy risk estimation of pulmonary nodules through calibration plots (also called reliability diagrams) in the development cohort from the National Lung Screening Trial (NLST), left, and the full external validation cohort from the Danish Lung Cancer Screening Trial (DLCST), right.
Table 1. Brier score loss and binary cross-entropy for the DL algorithm on the NLST and DLCST cohorts before and after calibration with Platt’s scaling.
| Cohort | Brier score loss | Binary cross-entropy |
|---|---|---|
| NLST (development) | Uncalibrated: 0.091; Calibrated: 0.049 | Uncalibrated: 0.308; Calibrated: 0.170 |
| DLCST (external validation) | Uncalibrated: 0.055; Calibrated: 0.045 | Uncalibrated: 0.211; Calibrated: 0.155 |
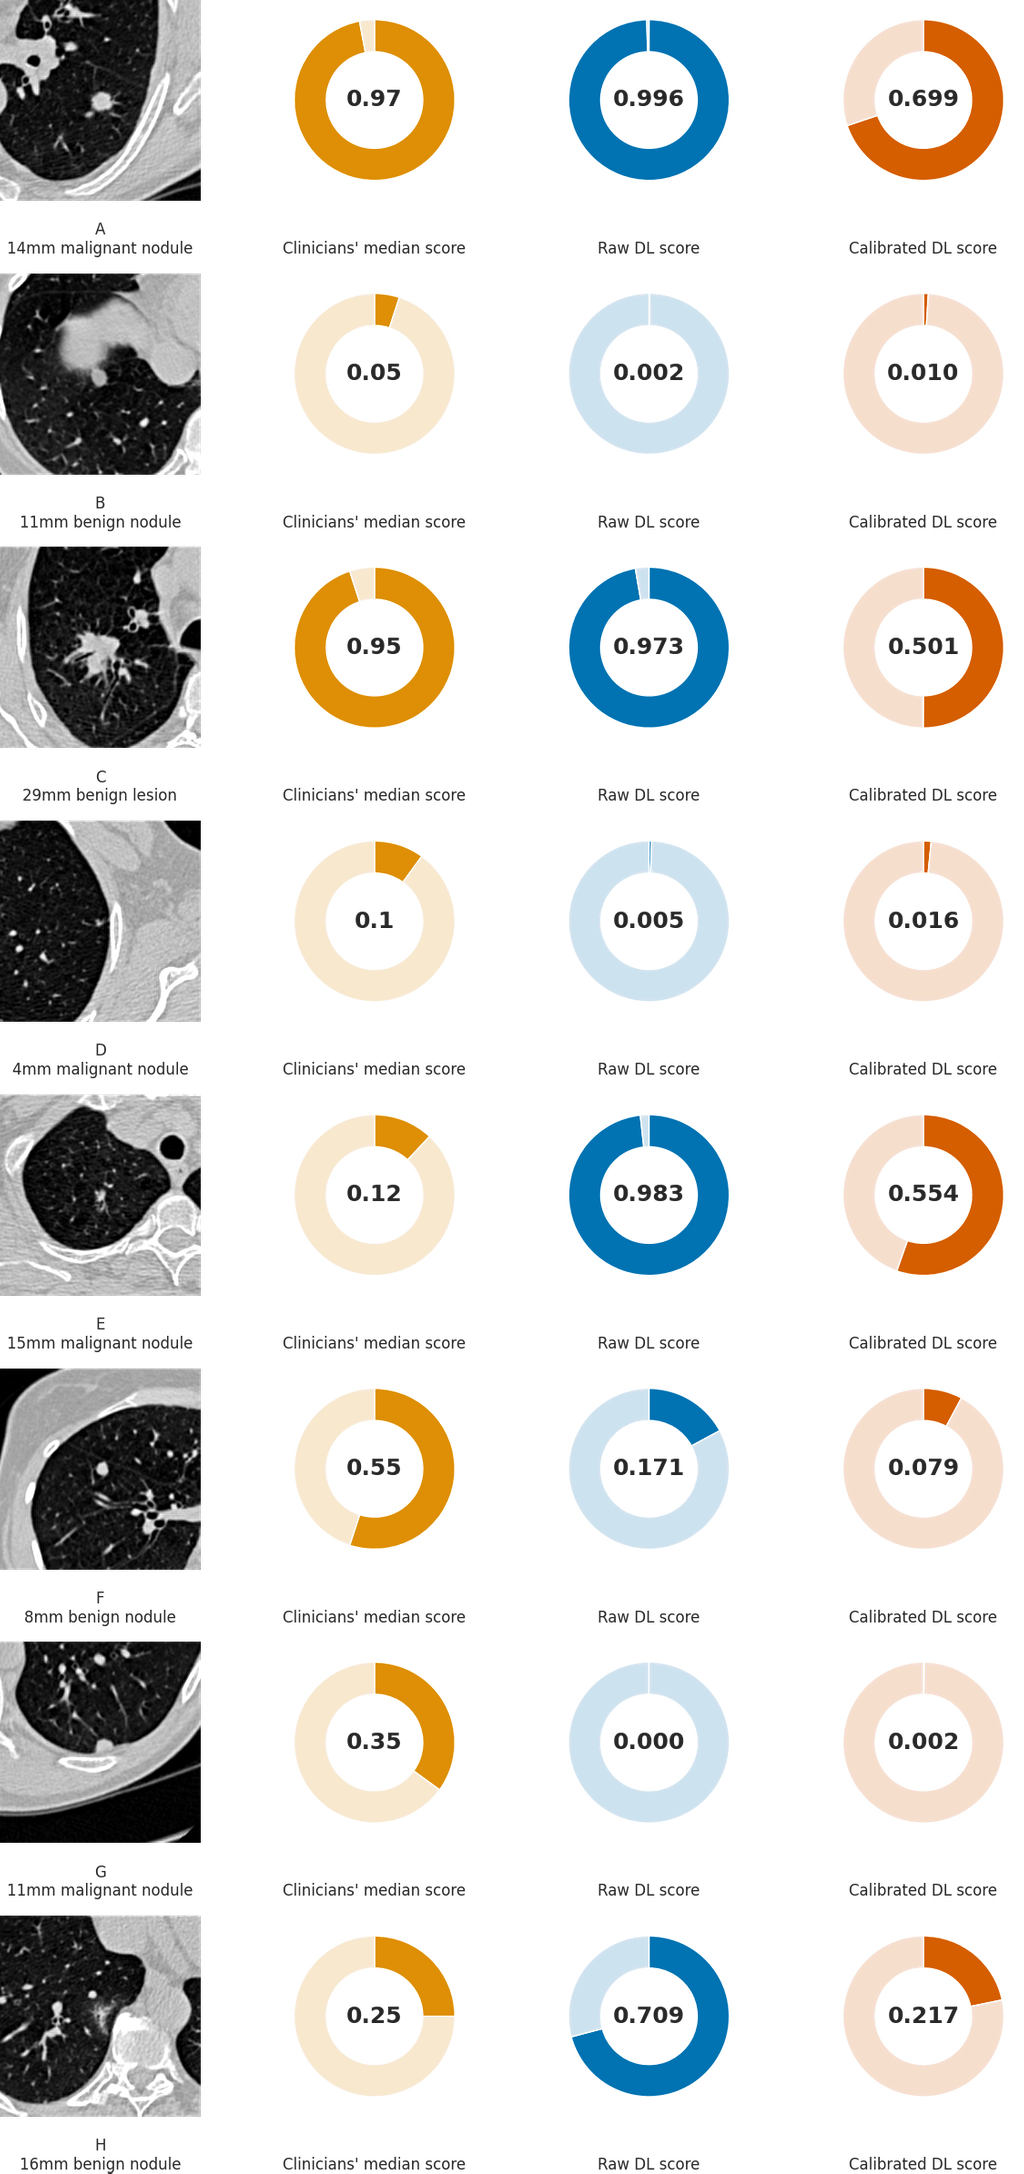
Figure 3. Examples of CT images in nodules from the Danish Lung Cancer Screening Trial (DLCST) with (A-D) high and (E-H) low agreement between the deep learning (DL) algorithm and the clinicians for malignancy risk estimation. The raw DL outputs are shown along with the calibrated DL risk scores for each nodule from Figure 5 of our publication.
Summary
The previous version of our deep learning (DL) algorithm for malignancy risk estimation of pulmonary nodules produced uncalibrated malignancy risk scores. The algorithm produced overconfident and polarized outputs, with the malignancy risks close to either 0 or 1. In this article, we described how we used Platt’s scaling to calibrate the DL algorithm’s probabilities. Qualitative assessments through histogram density plots and reliability diagrams and quantitative assessments with the Brier score loss show that the algorithm has better calibration. We made both the uncalibrated outputs and the calibrated outputs available through the publicly available algorithm on grand-challenge.org.